How often should you expect to see a 1-in-5 loss over a five-year period? (hint: the answer isn’t 100%...)
James McIlwaine FIA
Chief Product Officer
Return periods are one of the oldest tools used in catastrophe modelling and actuarial pricing generally. Yet despite appearing deceptively simple, return periods can be easily misinterpreted, causing confusion for both catastrophe risk professionals and the general public.
The term return period here is used in the typical general insurance context. This takes a 1-in-10 year event to be an event that is observed on average once every ten years (i.e. a 10% chance of occurring in a given year). There are some alternative definitions of return periods in use, but this is the generally accepted one in the (re)insurance industry.
This post lays out some common misconceptions to avoid when making decisions based on return periods.
1. Without explicit reference to the peril/region/measure/state we are discussing, return periods mean nothing.
To go back to a claim that was widely reported during Hurricane Ian, the "1-in-1,000" figure quoted in the news[1] referred to the level of flooding in certain Florida locales. Without this being clarified, we could have been left with the impression that Ian was a 1-in-1,000 year event for the state of Florida or for the USA as a whole, and that this referred to financial loss rather than the level of rainfall.
Indeed, if taken to a granular enough level (e.g., rainfall per square metre), 1-in-1,000 year events likely happen every day! This is why it is so important to have a clear definition. To be meaningful, a return period should specify:
A. The region/area involved.
B. The peril(s)/potential causes of loss or damage we are interested in.
C. What we are measuring. This could be tropical cyclone wind-speed, earthquake ground shaking, economic loss on an occurrence or aggregate basis or any other number of metrics.
D. In some cases we may need to specify a particular state or other climate-specific variables e.g., return periods may be conditional on being in a certain phase of the ENSO cycle or a particular emissions scenario when looking at the impact of climate change. There is an implicit assumption of stationarity in the underlying conditions being observed across all return periods.
2. A 1-in-5 loss doesn’t happen exactly every five years. Over a 5-year period, you will witness an event exceeding the 1-in-5 year loss over 67% of the time![2]
The reason for this is a subtle distinction in definition. A 1-in-5 loss has a 20% chance of being exceeded in any given year. Thus, we have an 80% chance in any given year of not seeing a 1-in-5 loss. To work out the chances of there not being a 1-in-5 loss over 5 years, we would need this 80% outcome to happen five times in a row. This can be calculated as 0.8 x 0.8 x 0.8 x 0.8 x 0.8 = 32.8%, so if there is a 32.8% chance of this not occurring, there must be a 67.2% chance of at least one such loss occurring.
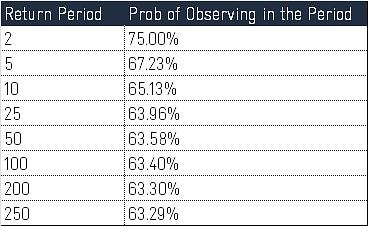
To illustrate this point for other timeframes, the table below shows the chances of observing a loss exceeding the specified return period over a number of timescales:
Fig.1 Probability of observing at least one loss of a given return period during the stated number of years
So for example, we’d expect to see at least one 1-in-250 event 63.29% of the time over any given 250-year period.
3. We should routinely expect losses for greater return periods than the timescales we are looking at.
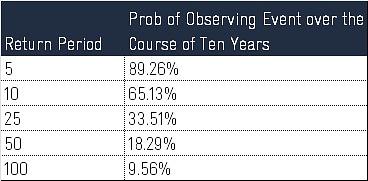
Using a similar logic to point 2, the table below shows how likely particular return period losses are over a 10-year timeframe:
Fig.2 Probability of observing losses above given periods during a 10-year period
This shows us that we shouldn’t be surprised to see much higher return period losses occurring within our timeframe as they should still be relatively common. For example, there is an 18% chance of witnessing a 1-in-50 event in a 10-year period.
4. Outcomes that seem remote quickly become likely when you are monitoring return periods across a wide array of region-perils.
If you’re monitoring a portfolio with 25 region-perils, it’s not unreasonable to expect a 1-in-25 loss for one of your region-perils every year (with the caveat of assuming limited correlation between perils). This goes some way to explaining why we rarely see a completely quiet year with no significant catastrophe events.
5. Singular return period values provide no information about the points that lie beyond.
While you may be able to make a reasonably informed guess about where the 1-in-100 loss will lie based on the 1-in-10 and 1-in-50, return periods only give you information about one specific point on the curve. A strong focus on monitoring just one or two specific return periods can lead to a myopic view of catastrophe risk management that negates potential events either side of the return periods in question. TVaR[3] (Tail value at Risk) can be used as an alternative if you wish to capture information about the potential losses or intensities that lie further out in the tail.