The Importance of Diverse Structural Models and Defensible Loss Analysis
Dr Tom Philp
Chief Executive Officer
Today, 1st June, marks the start of the Atlantic Hurricane season – seemingly not a moment too soon, as the National Hurricane Center (NHC) monitors a tropical disturbance in the centre of the Gulf of Mexico, and the ECMWF model looks to be taking it directly south (!) toward Cuba (though it doesn’t manage to structure itself much before dissipating, so no huge alarm bells - at least at present). After a few successive years of high and often unusual activity in the Atlantic basin, it doesn’t seem surprising to be talking about peculiar tropical events at such an early date.
Model Predictions 2023
Looking ahead to the entire 2023 season, narratives have already started to abound across the industry about the difficulty in finding coherence in the seasonal forecasts this year – the excellent Dr. Richard Dixon has already neatly framed the “Battle Royale”[1] shaping up between what looks like an impending El Niño event (which tends to cause a drop in the frequency of Atlantic hurricanes) and abnormally high Sea Surface Temperatures (SSTs) which are broadly predicted to persist[2] through the season in much of the tropical Atlantic (and can act to increase hurricane intensity). So – the question on the portfolio manager’s lips - which beast will win this battle royale? Will it be El Niño’s high wind shear that keeps a lid on hurricane development, or will it be the raw engine fuel made available from the SSTs that unchains the irascible atmosphere?
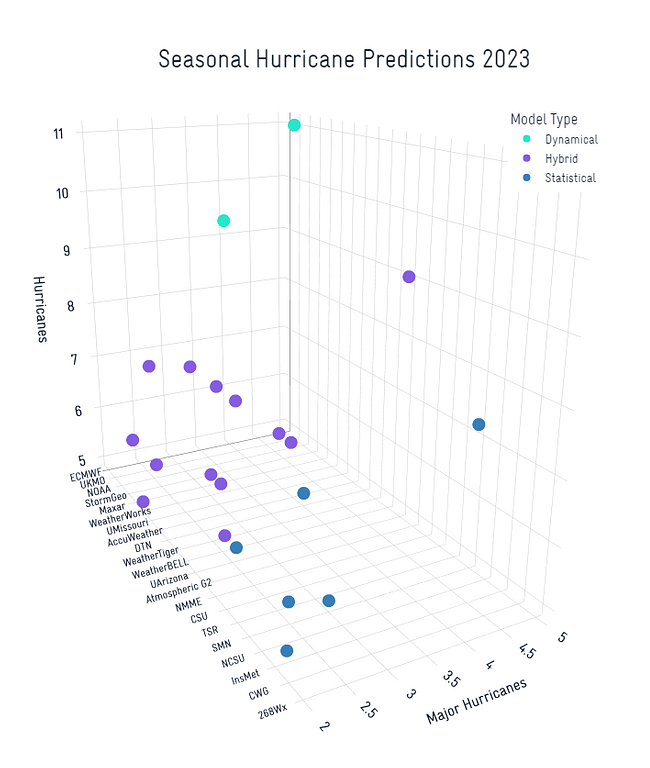
To dig further into the beliefs of different model types in this debate, I generated the following graph, which shows the predictions from each of the forecast centres that officially submit to the great Seasonal Hurricane Predictions initiative[3]:
Figure 1: 2023 Seasonal Hurricane Predictions submissions from 21 centres that use either a dynamical, statistical, or "hybrid" statistical-dynamical modelling approach. Major (cat 3+) Hurricane predictions are shown on the x-axis, while overall (cat 1-5) Hurricane predictions are shown on the z (vertical) axis. The y-axis extending moving away from the reader lists the centres of forecast submission. The colours of the markers indicate which model type is used for the predictions. Two of the centres (namely ECMWF and InsMet) have not provided Major Hurricane predictions for this year, and so the mean ratio of MajorHurricanes:Hurricanes across all of the centres has been applied to their cat 1-5 Hurricane Prediction numbers to derive a reasonable estimate. Note how high the dynamical models sit compared to most of the others - this will be explored later in this post. Raw figures are available here: https://seasonalhurricanepredictions.bsc.es/
It is very interesting to note that different structural models (dynamical vs statistical/hybrid) evidently have quite different beliefs this year. Most statistical and hybrid models are all relatively well clumped together, with the vast majority predicting roughly between 2-3 major hurricanes in the basin, and approximately 5-7 hurricanes. A season reaching these numbers would peg us at roughly an average to slightly below average activity year, climatologically speaking.
Historical Impacts of El Niño
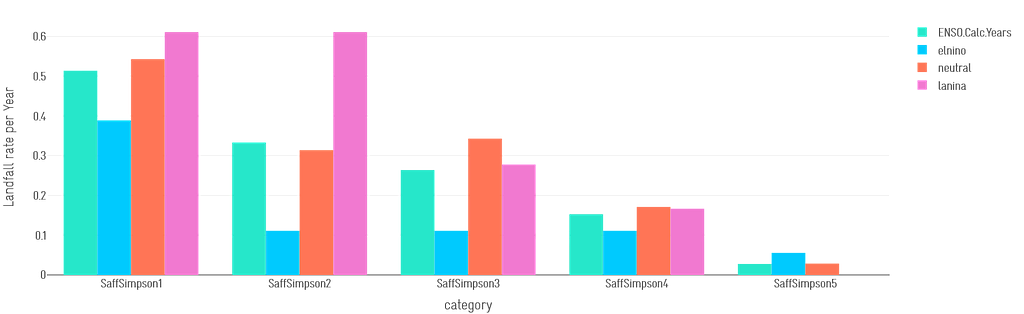
This slightly below average climatological narrative is quite neatly explained by the general impact of El Niño events on historical US landfall activity, which is summarized in the plot below (for more flavour, see James McIlwaine's excellent blog on the topic from February):
Figure 2: ENSO-phase driven US landfall probabilities derived from historical data (1950-2021), disaggregated by Saffir-Simpson category
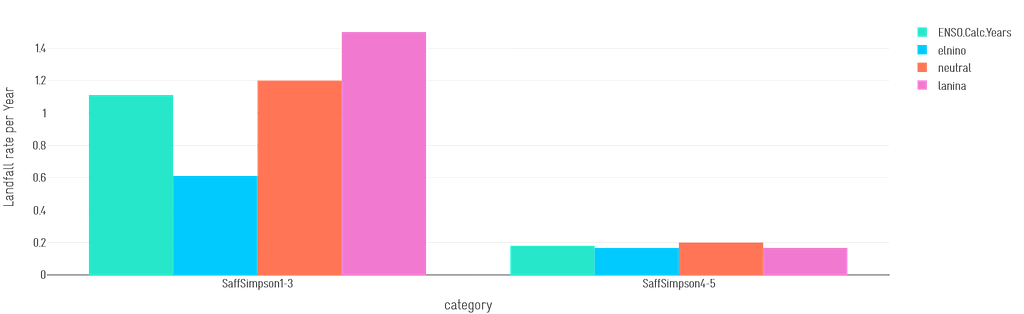
It doesn’t take Sherlock Holmes, however, to spot that the data above are a little problematic. While there looks to be a clear signal that El Niño phases see fewer storms generally, when we look to the category 5 bucket we notice that El Niño has seen a large spike in historical activity compared to other phases. We at Maximum Information believe this is more likely to be noise than signal – generated as a result of a short period of US landfall data (1950-2021) being sub-divided into three ENSO phases, and further sub-divided into five intensity (Saffir-Simpson category) buckets. To help alleviate this issue, we can re-think the disaggregation of hurricanes by individual category and re-bucket them as follows:
Figure 3: ENSO-phase driven US landfall probabilities derived from historical data (1950-2021), bucketed into Saffir-Simpson Category 1-3 & Category 4-5, following similar in Knutson et al. 2020.
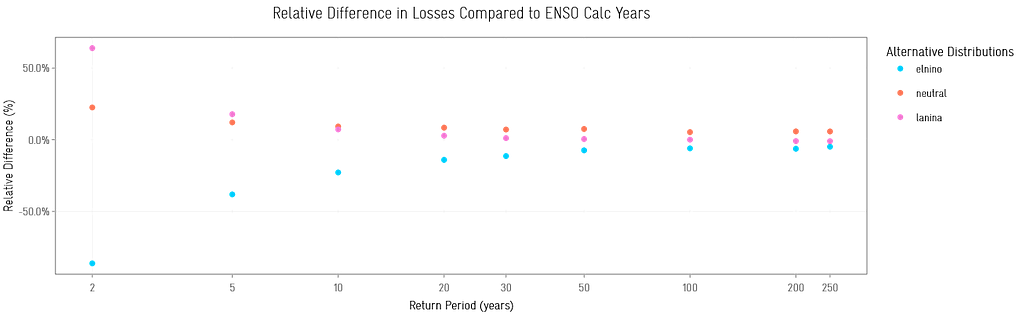
This suddenly looks more reasonable, though still leaves us with some uncertainty about the La Niña category 4-5 bucket, which arguably appears too low compared to other phases. However, leaving aside the nuances of this debate for now, at Maximum Information we have been working on ways to defensibly flow this type of hazard-focused information through catastrophe modelling frameworks, regardless of model vendor, data structure, or even loss model framework. Flowing such distributions through a hurricane catastrophe model in a coherent manner and using an industry exposure database to investigate impacts on insured loss, we derive the following relativities on impacts to cat-risk related losses at multiple return periods:
Figure 4: ENSO-phase driven IED loss impacts across multiple return periods. The zero-line represents all years treated as one (i.e. represents the overall climatology of the 1950-2021 period)
This type of plot may give us some confidence that, from an Atlantic hurricane perspective, an El Niño year may provide a little respite from three years of La Niña (though interestingly the - arguably short and problematic - history points to neutral phases being of most concern).
The Spectre of Dynamics
Referring back to figure 1, the ominous spectre of two of the world’s leading weather and climate forecasting centres – the European Centre for Medium-range Weather Forecasting (ECMWF) and the UK Met Office (UKMO) – looms well above the pack of statistical and hybrid models predicting an average-to-low activity year ahead, with each centre forecasting a season of much higher than average activity (9.3 and 11 hurricanes in the basin respectively). Both of these centres deploy their full physics-based models to generate the only two dynamical predictions publicly available on the Seasonal Predictions site. As the only models that are structurally physics-based, their results are impossible to ignore as they add potentially unique information.
Most importantly, their predictions may be feeding off the forecasted high SST anomalies, the magnitudes of which have rarely been seen in our historical record. They are so high as to reasonably call into question whether historical statistics-based models are truly useful for the season ahead. Further, being fully physics based, they are also likely to be pulling through some of the El Niño induced atmospheric impacts, so aren't likely to be completely missing things like wind shear either. The downsides of these dynamical models, though, must be faced head on: predicting extreme events in physics-based models that aren’t well constrained to history has, on occasion, proven challenging, especially for near-term risk management of human exposures. For example, some scientific studies published shortly before and following the hyper-active 2005 season called for a strong need to re-evaluate short-term baseline views of Atlantic hurricane risk based on physical theories, but this was followed by the infamous (and contentious) 10-year major hurricane US landfall drought. The debate still continues, with advocates on both sides of the fence.
So - physics vs statistics - where do you sit?
Climate Change as a proxy for 2023?
One final further thought to wrap up – there is a fascinating coincidence that we can use to play thought-experiments with this year. The same high-level narrative we have before us for the upcoming season – high SST anomalies coupled with El Niño induced wind shear and other background climate impacts – are not much different from the general, macro narratives about likely climate conditions that are projected by physics-based models under future IPCC emissions scenarios. Can we therefore potentially look to climate change studies as a proxy for this year itself?
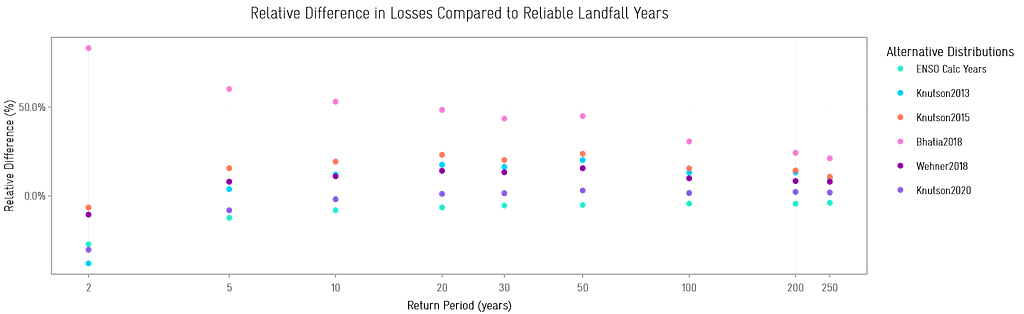
At Maximum Information we have also been looking into this. Many people in the industry will be familiar with the Knutson et al. 2020 study[4] that was highly cited for its incredible job at deconstructing and making comparable >100 studies focused on Tropical Cyclones under Climate Change. Recently, we pulled out many of the individual studies behind that summary paper. Looking at some of the highest resolution model runs (listed in the legend in figure 5), we see a consistent uptick in loss generated by the cat models – something that isn’t all that apparent from the background Knutson et al. 2020 median estimates, represented by the "Knutson2020" markers.
Figure 5: Relative loss across multiple return periods as in figure 4, but for multiple climate change studies. Note that the ENSO climatology period (1950-2021) is different from the long-term climate state (1900-2021) used to compare the climate change papers. Hence in this plot the zero-line represents the climatology from the period 1900-2021. The impact of moving to the more recent period is shown by "ENSO Calc Years"
I'll leave the reader to derive any thoughts on the above - it is a fascinating one to think through. What we can say for now – the battle for the 2023 season is underway, and it might just shine a gentle (but flickering and uncertain) torch on our broader hurricane future under unseen climate states.